A high occupancy rate can mask serious margin risks hiding in your highest-acuity wings. Here is why siloed data is costing you more than you think and how a unified data strategy changes everything.
Why a 95% EHR Occupancy Rate Can Be a Warning Signal, Not a Win
On a standard EHR dashboard, a 95% occupancy rate looks like a green light. Leadership celebrates. KPIs turn green. But for an Executive Director or CFO who knows where to look, that same number can be a warning.
Healthcare data silos impact on margins more than most leadership teams realize.
If that occupancy is concentrated in your highest-acuity wing, the “true” cost of those patients might be quietly eating into your margins in ways your financial software simply cannot see on its own.
The problem is not the metric itself, it is the context missing around it. A single number, viewed in isolation, tells only part of the story.
The Real Cost of Data Silos in Healthcare Operations
When your EHR, Finance, Dining, and Facilities systems do not talk to each other, you are not managing a single organization; rather, you are managing a fragmented organism. Each department functions independently, but leadership never sees how the whole system performs together.
The result is predictable: hidden inefficiencies, reactive decision-making, and missed growth opportunities. And in an environment of tightening margins and expanding regulatory pressure, that is a competitive disadvantage you cannot afford to ignore.
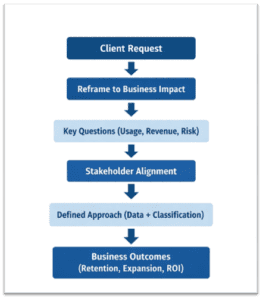
Introducing the “Master View”: What Unified Data Actually Looks Like
By integrating these datasets, leadership gains a Master View, a single, connected picture that reveals the strengths and weaknesses of the system as a whole, not department by department. Here is what becomes possible when your data works together:
👁Identify sustainable service lines
Combining billing data with EHR acuity scores exposes which service lines are truly sustainable and which are being quietly subsidized by phantom capacity.
👁Optimize for patient needs
Integrating dining data with clinical schedules lets you move beyond cost-cutting into genuine patient-centered optimization.
👁Impact clinical outcomes
You begin to see how facility layout and environment directly impact clinical outcomes and staff retention — connections that siloed reports never reveal.
👁Detect anomalies early
Advanced analytics enable teams to detect and manage unexpected cost irregularities in real time, significantly reducing operational risk before it becomes a crisis.
From Better Dashboards to Better Decisions
In a world of tightening margins and expanding regulatory pressure, siloed reporting is no longer enough. A unified data strategy is not just about building better dashboards; it is about seeing your organization as a living, interconnected system and acting on insights that drive meaningful, measurable change.
Organizations that embrace this approach can scale more effectively, respond faster to change, and achieve unmatched operational efficiency. The competitive edge is not just technological; it is organizational clarity at every level of leadership.
Frequently Asked Questions
A 95% EHR occupancy rate means nearly all beds or care slots are filled. While this looks positive on a surface-level dashboard, it can signal margin risk if that occupancy is concentrated in high-acuity areas where the true per-patient cost exceeds what billing recovers.
Healthcare data silos occur when core systems — EHR, Finance, Dining, and Facilities — operate independently without sharing data. This prevents leadership from seeing how the whole organization performs together, leading to reactive decisions and hidden inefficiencies.
A Master View Dashboard is a unified reporting tool that integrates data from multiple operational systems — clinical, financial, dietary, and facilities into a single leadership view. It helps organizations identify sustainable service lines, detect anomalies early, and make data-driven decisions at scale.
By combining EHR acuity data with billing and operational data, a unified strategy exposes which service lines generate real returns versus those subsidized by phantom capacity — giving leadership the insight to reallocate resources and protect margins proactively.
Your data has been trying to tell you something. It is time to listen. Tying your organism together starts with one step toward unified data.