Navigating the financial landscape is no longer a game of chance. For CFOs and COOs, the need for actionable insights derived from operational data and customer interactions has become paramount. Gone are the days when intuition or outdated methods sufficed for decision-making. In our previous piece, “Financial Clarity: Business Analytics Illuminates Growth,” we discussed how Business Analytics (BA) can illuminate the growth path.
Today, we dive deeper into how BA can empower financial SMEs with a Management Dashboard – the central hub for visualizing key metrics that drive success.
Key Metrics for Financial Leadership
Monitoring key metrics is crucial to ensure that every level of your organization is aligned and informed. Here’s how focusing on the right metrics can transform your business
Customer Acquisition: Understand how your company attracts new customers effectively. Metrics such as Cost per Acquisition and Customer Lifetime Value are not just numbers; they are the compass that guides your marketing and sales strategies. By analyzing these metrics, you can optimize your budget allocation and maximize returns on marketing investments.
Customer Satisfaction: Customer satisfaction isn’t just a feel-good metric; it directly impacts your bottom line. Tracking Net Promoter and Customer Satisfaction Scores can help you gain insights into customer loyalty and service quality. This data helps identify improvement areas, ensuring your customers remain happy and engaged, ultimately driving repeat business and referrals.
Operational Efficiency: Operational efficiency is the backbone of a well-oiled financial SME. Metrics such as Loan Processing Time and Account Opening Time highlight the effectiveness of your internal processes. For a COO, these metrics are invaluable in identifying bottlenecks and streamlining workflows, leading to increased productivity and reduced operational costs.
Financial Performance: Financial performance metrics are the pulse of your company’s health. Return on Investment (ROI) and Loan Delinquency Rate clearly show your financial stability and growth potential. For a CFO, these metrics are essential for making informed investment decisions, resource allocation, and risk management.
Remember, these are just some KPIs you can track with a BA Management Dashboard. The specific KPIs you choose will depend on your unique business goals and priorities.
Harnessing the Power of Business Analytics Tools
With the critical KPIs identified and understood, the next step for financial leaders is to leverage the right tools to monitor and analyze these metrics effectively. In today’s data-driven world, the landscape of Business Analytics tools has evolved to offer powerful, user-friendly solutions designed specifically for financial SMEs. Let’s explore how these tools can transform your raw data into actionable insights and drive your company’s strategic decisions forward.
Cloud-based BA platforms have revolutionized how financial SMEs manage data by offering scalable, cost-effective storage, analysis, and visualization solutions without requiring extensive IT infrastructure. These platforms often include pre-built dashboards and reports featuring templates specifically designed for key financial metrics and industry trends. This saves valuable time and ensures decision-makers can focus on the most critical KPIs. Additionally, advanced data visualization tools transform raw data into easily comprehensible charts and graphs, allowing technical and non-technical stakeholders to grasp insights and make informed decisions.
Beyond the Tools: Mastering the Data Tracking & Analysis
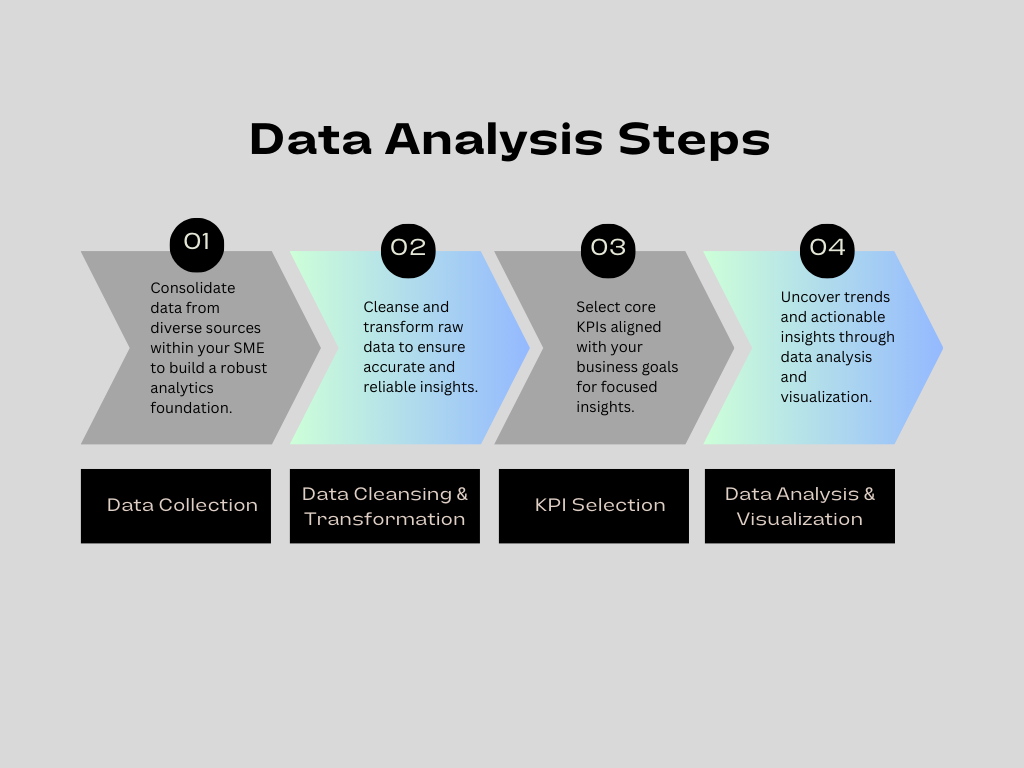
While tools are crucial, mastering the process is equally important. Here’s a breakdown:
- Data Collection: The foundation of business analytics lies in gathering data from various sources within your financial SME. This could include loan applications, customer interactions, internal systems, and marketing campaigns. Standardizing data collection formats and utilizing data integration tools can streamline this process.
- Data Cleansing & Transformation: Raw data can be messy. Data cleansing involves identifying and correcting errors, inconsistencies, and missing values. This ensures accurate analysis and reliable insights.
- KPI Selection: Don’t get overwhelmed! Choose a focused set of KPIs that directly align with your business goals. The Mofu content we discussed previously explored key KPIs relevant to financial SMEs (Customer Acquisition, Customer Satisfaction, Operational Efficiency, and Financial Performance).
- Data Analysis & Visualization: This is where your chosen BA tools come into play. Leverage data analysis features and visualization tools to uncover trends, identify patterns, and gain actionable insights from your KPIs.
Lead With Insight
As we navigate SMEs’ specific challenges, Insight Consultants emerges as a strategic ally, providing tailored solutions to empower organizations for sustained success. Our Data Intelligence Center of Excellence (DICE) features a skilled team comprising data engineers, scientists, and business analysts. We specialize in tailored data management and analytics solutions for small and medium enterprises.
Our offerings:
- Expertise in selecting the right BA tools and platforms. : We work with you to assess your budget, technical skills, and business goals. Using comparison tools and analysis, we recommend the perfect BA solution for your financial SME – cloud-based (Power BI, Google Data Studio), on-premise, or a custom mix.
- Guidance on data collection, cleansing, and KPI selection: Our team tackles your data from start to finish. We streamline collection from various sources (CRMs, applications, forms), ensure accuracy through cleaning and validation tools, and guide you in selecting KPIs that perfectly align with your financial SME’s goals, leveraging industry benchmarks and frameworks.
- Advanced analysis & clear visualizations: We utilize advanced tools (R, Python, data mining) to uncover hidden trends and correlations within your KPIs. These insights are then transformed into clear, actionable strategies through custom dashboards built with data visualization software. We collaborate to translate these findings into concrete actions for growth, like campaign optimization or process streamlining.
Don’t let your data remain a mystery! Learn how we can empower your financial SME with the right BA tools and expertise to unlock growth.